In this evaluation, we will focus on rainfall and mean sea level pressure from 31 January to 3 February 2025. The example shows analysis of the following parameters:
1. Set Up Your Environment and Find ECMWF Open Data
If the packages are not installed yet, uncomment the code below and run it.
# !pip3 install earthkit ecmwf-opendata xarrayfrom ecmwf.opendata import Client
import earthkit.data as ekd
import earthkit.plots as ekp
import os
import xarray as xrList of parameters to retrieve from open datasets
The selected values below can be modified.
Parameters available on a single level:
PARAM_SFC = "tp"
LEVELTYPE = "sfc"

DATES = [20250131]
TIME = 0
STEPS = 96
STREAM = "enfo"
TYPE = ["cf", "pf"]
MODEL = "ifs"
To calculate ensemble mean and spread, we need both the cf and pf type. This means that we will download the control forecast as well as all 50 ensemble members.
In this case, the ensemble median is more suited than ensemble mean, because the precipitation parameter usually has skewed distributions.
Data and plots directories
DATADIR = './data_dir/'
os.makedirs(DATADIR, exist_ok=True)

PLOTSDIR = './plots/'
os.makedirs(PLOTSDIR, exist_ok=True)
Get the data using the ECMWF Open Data API
def get_open_data(date, time, step, stream, _type, model, param, leveltype, levelist=[]):
    client = Client(source="aws")
    list_of_files = []
    # Get the data for all dates
    for _date in DATES:
        filename = f"{DATADIR}{model}_{''.join(param)}_{''.join(map(str, levelist))}_{_date}.grib2" if levelist else f"{DATADIR}{model}_{''.join(param)}_{leveltype}_{_date}.grib2"
        data = client.retrieve(
            date=_date,
            time=time,
            step=step,
            stream=stream,
            type=_type,
            levtype=leveltype,
            levelist=levelist,
            param=param,
            model=model,
            target=filename
            )
        list_of_files.append(filename)
    return data, list_of_files
2. Ensemble median of total precipitation
The tp parameter and step=96 give information about total accumulated rainfall from 00 UTC up to 4 days ahead.
We will sort the ensemble member numbers in an ascending order.
data, list_of_files = get_open_data(date=DATES,
                                    time=TIME,
                                    step=STEPS,
                                    stream=STREAM,
                                    _type=TYPE,
                                    model=MODEL,
                                    param=PARAM_SFC,
                                    leveltype=LEVELTYPE,
                                    levelist=[])

# Select IFS model data on 31 January 2025
ds = ekd.from_source("file", list_of_files[0])
ds = ds.order_by(["number"])
ds.ls()We will calculate the median of all the ensemble members. The units will be automatically converted to milimeters by the earthkit package.
xr.set_options(keep_attrs=True)

dsx = ds.to_xarray()
tpx = dsx['tp']
median_tp = tpx.median("number")
median_tp = median_tp.assign_attrs(tpx.attrs)
median_tp.attrs['units'] = 'mm'
median_tpAfter calculating the ensemble median, we can convert the Xarray dataset into a GRIB fieldlist using to_fieldlist(). The head() method displays up to 5 messages. When using n as a keyword argument, we can list any number of rows (if they are available).
tp = median_tp.earthkit.to_fieldlist()
tp.head()PARAM_SFC = "msl"
LEVELS = []
LEVELTYPE = "sfc"
DATES = [20250131]
TIME = 0
STEPS = 72
STREAM = "enfo"
TYPE = ["cf", "pf"]
MODEL = "ifs"data, list_of_files = get_open_data(date=DATES,
time=TIME,
step=STEPS,
stream=STREAM,
_type=TYPE,
model=MODEL,
param=PARAM_SFC,
leveltype=LEVELTYPE,
levelist=[])
# Select IFS model data on 31 January 2025
ds_msl = ekd.from_source("file", list_of_files[0])
ds_msl = ds_msl.order_by(["number"])
ds_msl.ls()We will plot mean sea level pressure data in hPa, therefore we need to divide them by 100.
ensemble mean
dsx = ds_msl.to_xarray()
mslx = dsx['msl'] / 100
mean_msl = mslx.mean("number")
mean_msl = mean_msl.assign_attrs(mslx.attrs)
mean_msl.attrs['units'] = 'hPa'
mean_mslmsl = mean_msl.earthkit.to_fieldlist()
msl.describe("msl")ensemble spread
spread_msl = mslx.std("number")
spread_msl = spread_msl.assign_attrs(mslx.attrs)
spread_msl.attrs['units'] = 'hPa'
spread_mslmsl_std = spread_msl.earthkit.to_fieldlist()
msl_std.ls()4. Data visualisation
The plot below shows the analysis of ensemble median of total precipitation on 31 January 2025.
chart = ekp.Map(domain="Australia")

hex_colours = ['#00ffff', '#0080ff', '#0000ff', '#d900ff', '#ff00ff', '#ff8000', '#ff0000', '#333333', ]

tp_shade = ekp.styles.Style(
    colors = hex_colours,
    levels = [0.5, 2, 4, 10, 25, 50, 100, 250],
    units = "mm",
    extend = "max",
)

chart.contourf(tp, style=tp_shade)

chart.coastlines(resolution="low")
chart.gridlines()
chart.cities(adjust_labels=True)

chart.legend(location="bottom", label="{variable_name} ({units})")

chart.title(
    "IFS: Ensemble median of {variable_name} over {domain}\n"
    "{base_time:%Y-%m-%d %H} UTC (+{lead_time}h)\n",
    fontsize=14, horizontalalignment="center",
)
chart.save(f"{PLOTSDIR}{PARAM_SFC}_{MODEL}_{DATES[0]}{TIME}-{STEPS}h.png")
chart.show()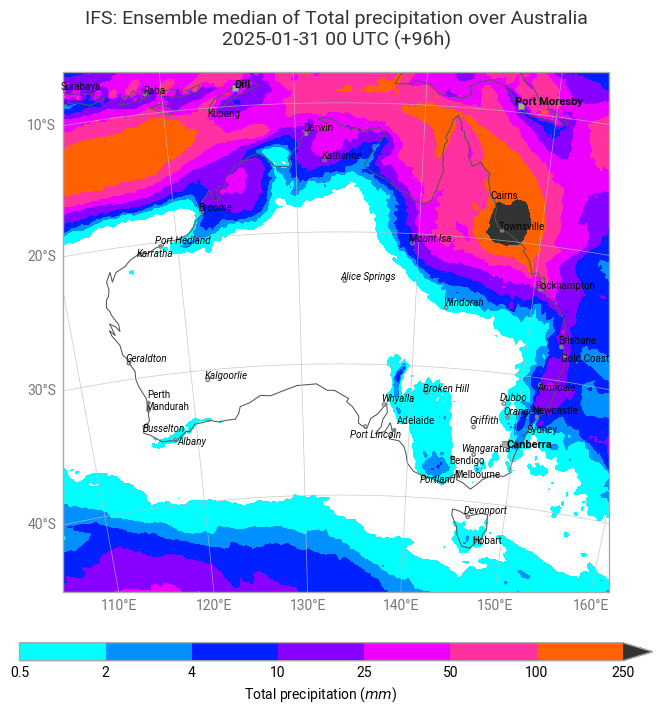
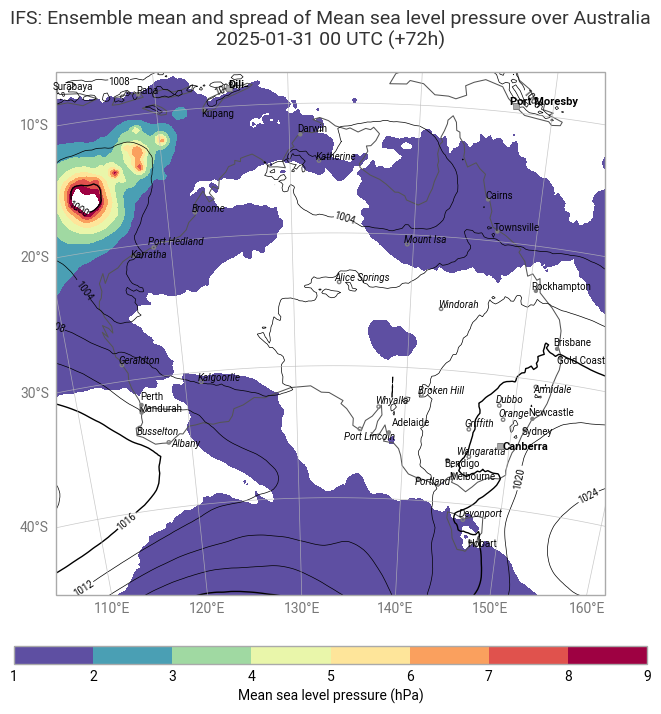
The plot below show the analysis of ensemble mean and spread of mean sea level pressure on 31 January at 00 UTC and for step=72.
chart = ekp.Map(domain="Australia")

mslstd_style = ekp.styles.Style(
    colors="Spectral_r",
    levels=range(1, 10, 1),
    extend="both",
)

chart.contourf(msl_std, style=mslstd_style)
chart.contour(msl,
              levels={"step": 4, "reference": 1000},
              linecolors="black",
              linewidths=[0.5, 1, 0.5, 0.5],
              labels = True,
              legend_style = None,
              transform_first=True)

chart.coastlines(resolution="low")
chart.gridlines()
chart.cities(adjust_labels=True)

chart.legend(location="bottom", label="{variable_name} (hPa)")

chart.title(
    "IFS: Ensemble mean and spread of {variable_name} over {domain}\n"
    "{base_time:%Y-%m-%d %H} UTC (+{lead_time}h)\n",
    fontsize=14, horizontalalignment="center",
)
chart.save(f"{PLOTSDIR}{PARAM_SFC}_{MODEL}_{DATES[0]}{TIME}-{STEPS}h.png")
chart.show()