Here we will focus on:
2t2 metre temperature,mn2t3minimum temperature at 2 metres in the last 3 hours, and10fgg1010 metre wind gust of at least 10 m/s in Argentina on 29 June at 00 UTC.
1. Set Up Your Environment and Find ECMWF Open Data
If the packages are not installed yet, uncomment the code below and run it.
# !pip3 install earthkit ecmwf-opendatafrom ecmwf.opendata import Client
import earthkit.data as ekd
import earthkit.plots as ekp
import earthkit
import osList of parameters to retrieve from open datasets
The selected values below can be modified.
Parameters available on a single level:
PARAM_SFC = ["mn2t3", "2t"]
LEVELTYPE = "sfc"

DATES = [20250629, 20250630, 20250701]
TIME = 0
STEPS = 6
STREAM = "oper"
TYPE = "fc"
MODEL = "ifs"
Data and plots directories
DATADIR = './data_dir/'
os.makedirs(DATADIR, exist_ok=True)

PLOTSDIR = './plots/'
os.makedirs(PLOTSDIR, exist_ok=True)
Get the data using the ECMWF Open Data API
def get_open_data(date, time, step, stream, _type, model, param, leveltype, levelist=[]):
    client = Client(source="aws")
    list_of_files = []
    # Get the data for all dates
    for _date in DATES:
        filename = f"{DATADIR}{model}_{''.join(param)}_{''.join(map(str, levelist))}_{_date}.grib2" if levelist else f"{DATADIR}{model}_{''.join(param)}_{leveltype}_{_date}.grib2"
        data = client.retrieve(
            date=_date,
            time=time,
            step=step,
            stream=stream,
            type=_type,
            levtype=leveltype,
            levelist=levelist,
            param=param,
            model=model,
            target=filename
            )
        list_of_files.append(filename)
    return data, list_of_files
2. 2-metre temperature and minimum temperature at 2 metres in the last 3 hours
data, list_of_files = get_open_data(date=DATES,
                                    time=TIME,
                                    step=STEPS,
                                    stream=STREAM,
                                    _type=TYPE,
                                    model=MODEL,
                                    param=PARAM_SFC,
                                    leveltype=LEVELTYPE,
                                    levelist=[])

# Select data from 29 June 2025
ds = ekd.from_source("file", list_of_files[0])
ds.ls()
Loading...
t2m = ds.sel(shortName="2t")
t2m.ls()
Loading...
t2min_K = ds.sel(shortName="mn2t3")

md_t2min = t2min_K.metadata()
ds_t2min = t2min_K.values - 273.15
t2min = ekd.FieldList.from_array(ds_t2min, md_t2min)
t2min.ls()
Loading...
PARAM_SFC = ["10fgg10"]
LEVELTYPE = "sfc"

DATES = [20250629, 20250630, 20250701]
TIME = 0
STEPS = "0-24"
STREAM = "enfo"
TYPE = "ep"
MODEL = "ifs"
The dump() method inspects all the namespace keys of a parameter.
data, list_of_files = get_open_data(date=DATES,
                                    time=TIME,
                                    step=STEPS,
                                    stream=STREAM,
                                    _type=TYPE,
                                    model=MODEL,
                                    param=PARAM_SFC,
                                    leveltype=LEVELTYPE,
                                    levelist=[])

# Select data from 29 June 2025
wg10 = ekd.from_source("file", list_of_files[0])[0]
wg10.dump()
Loading...
4. Data visualisation
The plots below show analyses of 2 metre temperature and minimum temperature at 2 metres in the last 3 hours on 29 June at 00 UTC.
figure = ekp.Figure(domain=[-80, -20, -55, -10], size=(9, 6), rows=1, columns=2)

t2m_shade = ekp.styles.Style(
    colors="Spectral_r",
    levels=range(-40, 50, 2),
    extend="both",
    units="celsius",
)

t2min_shade = ekp.styles.Style(
    colors="Spectral_r",
    levels=range(-40, 50, 2),
    extend="both",
)

figure.contourf(t2m, style=t2m_shade)
subplot = figure.add_map(0, 1)
subplot.contourf(t2min, style=t2min_shade)

figure.title("IFS: {variable_name} over South America\n {base_time:%Y-%m-%d %H} UTC (+{lead_time}h)\n")

figure.coastlines(resolution="low")
figure.gridlines()

figure.legend(location="bottom", label="Temperature (˚C)")

figure.save(fname=f"{PLOTSDIR}{''.join(PARAM_SFC)}_{MODEL}_{DATES[0]}{TIME}-{STEPS}h.png")
figure.show()
<Figure size 900x600 with 0 Axes>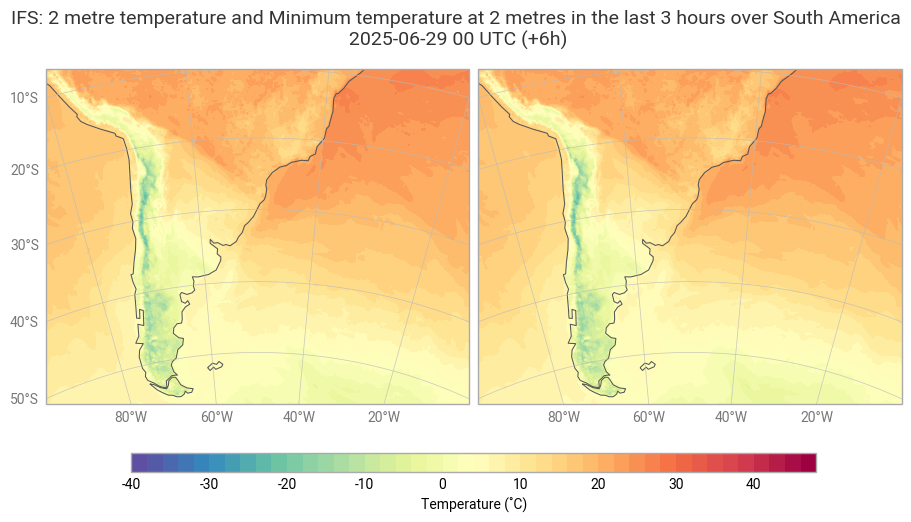
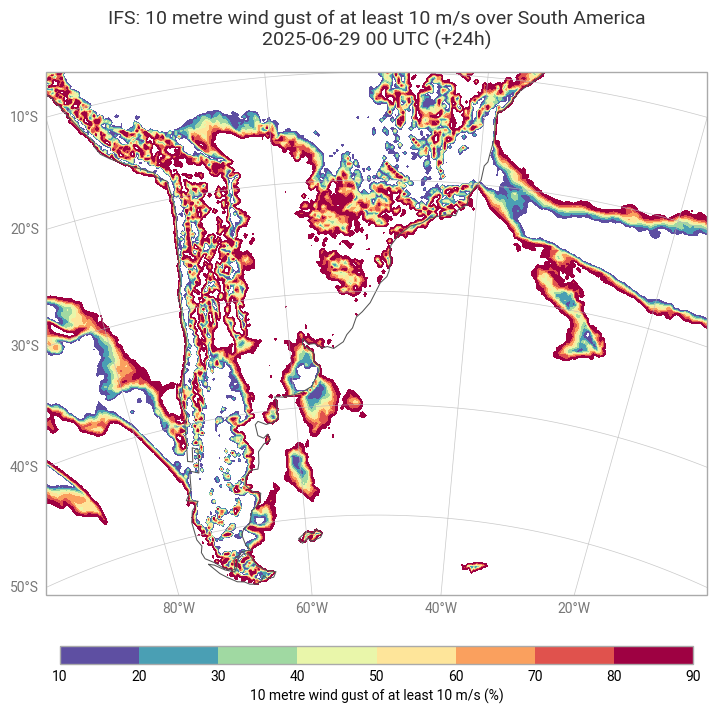
The plot below shows the analysis of 10 metre wind gust of at least 10 m/s on 29 June 2025.
chart = ekp.Map(domain=[-80, -20, -55, -10])

wg10_shade = ekp.styles.Style(
    colors="Spectral_r",
    levels=range(10, 100, 10),
    extend="both",
    transform_first=True,
)

chart.contourf(wg10, style=wg10_shade)

chart.coastlines(resolution="low")
chart.gridlines()

chart.legend(location="bottom", label="{variable_name} (%)")

chart.title(
    "IFS: {variable_name} over South America\n"
    "{base_time:%Y-%m-%d %H} UTC (+{lead_time}h)\n",
    fontsize=14, horizontalalignment="center",
)
chart.save(f"{PLOTSDIR}{''.join(PARAM_SFC)}_{MODEL}_{DATES[0]}{TIME}-{STEPS}h.png")
chart.show()